
Why Greater Boston
A world-class economy with the nation’s worst housing shortage creates a durable opportunity for disciplined real estate investing.
America’s #1 Housing Shortage
Zillow ranks Greater Boston as the worst housing shortage in the United States — ahead of Sacramento, Portland, San Diego, and San Francisco. Decades of underbuilding, restrictive zoning, and surging demand have created a structural deficit that shows no sign of closing.
- 1Boston
- 2Sacramento
- 3Portland
- 4San Diego
- 5San Francisco
Source: Zillow Research, “U.S. Cities with Worst Housing Shortages”
#6 U.S. Metro — A Knowledge-Powered Engine
With a combined statistical area of 8.5 million people, Greater Boston is one of the largest and wealthiest metros in the country. A concentration of elite universities, global employers, and cutting-edge health and biotech institutions fuels persistent housing demand and supports underlying real estate values.
- UniversityMIT
- UniversityHarvard
- UniversityBoston University
- UniversityTufts
- HealthcareMass General Brigham
- Financial ServicesFidelity
- Financial ServicesState Street
- BiotechModerna
- TechnologyHubSpot
- BiotechVertex
Sources: U.S. Census Bureau / ACS (2023); Boston Foundation / Boston Indicators, 2025 Greater Boston Housing Report Card
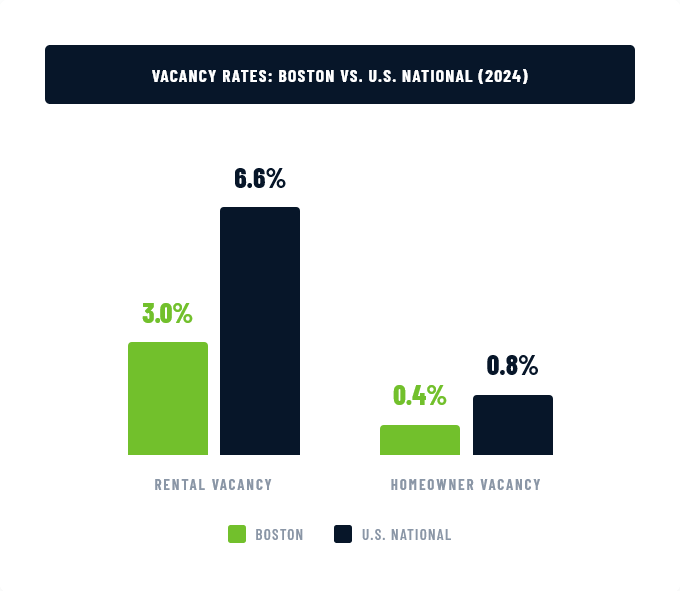
Vacancy Rates Far Below National Averages
Boston’s housing market faces relentless pressure. Rental vacancy stands at just 3% (2024) — less than half the national rate. Homeowner vacancy is a razor-thin 0.4%. This scarcity sustains robust demand for flexible private lending, particularly short-term strategies that can accelerate renovation and development faster than traditional approaches.
Sources: U.S. Census Bureau, Current Population Survey / Housing Vacancy Survey (2024)
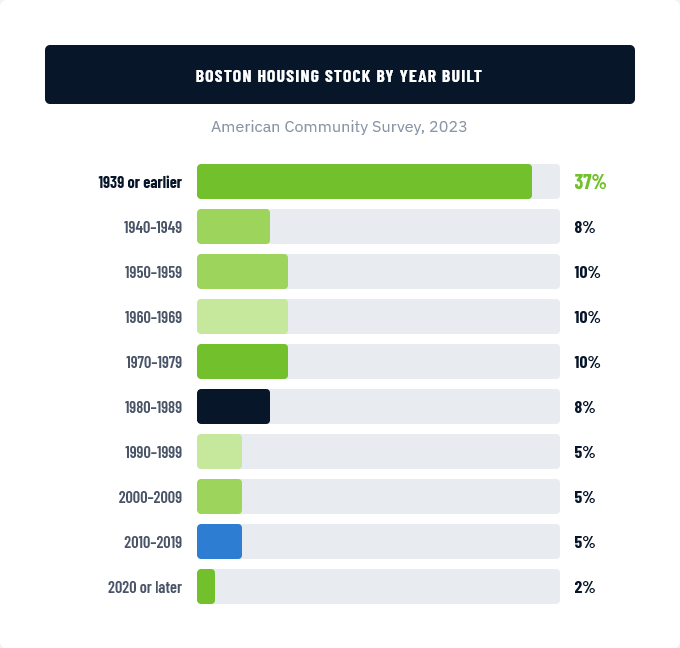
Roots of the Housing Crisis
Due to limited land, restrictive zoning, and chronically low new construction, nearly 40% of Greater Boston’s housing stock was built before World War II. This aging inventory drives persistent demand for renovation, rehab, and adaptive re-use — and the short-term capital that makes those projects possible.
Only 2% of the region’s housing was built in 2020 or later — a pace far too slow to address the deficit.
Source: U.S. Census Bureau / American Community Survey (2023); Federal Reserve Bank of St. Louis
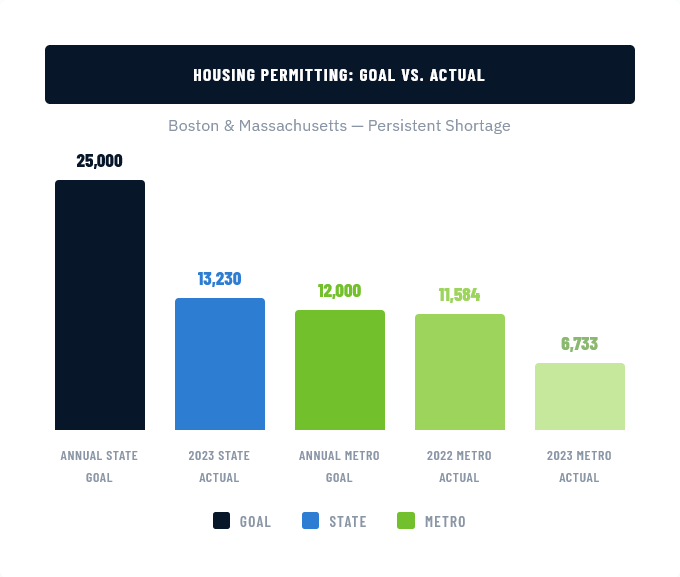
Policy Bottlenecks Constrain Supply
In Greater Boston, 177 separate zoning jurisdictions — each with their own rules, review boards, and timelines — create an obstacle course for new housing. Decades of neighborhood resistance and regulatory inertia have produced a persistent drag on development. Building permits have collapsed from 15,019 in 2021 to approximately 9,000 in 2024 — a 40% decline. Massachusetts has set a goal of 222,000 new units by 2035, but the current pace falls dramatically short.
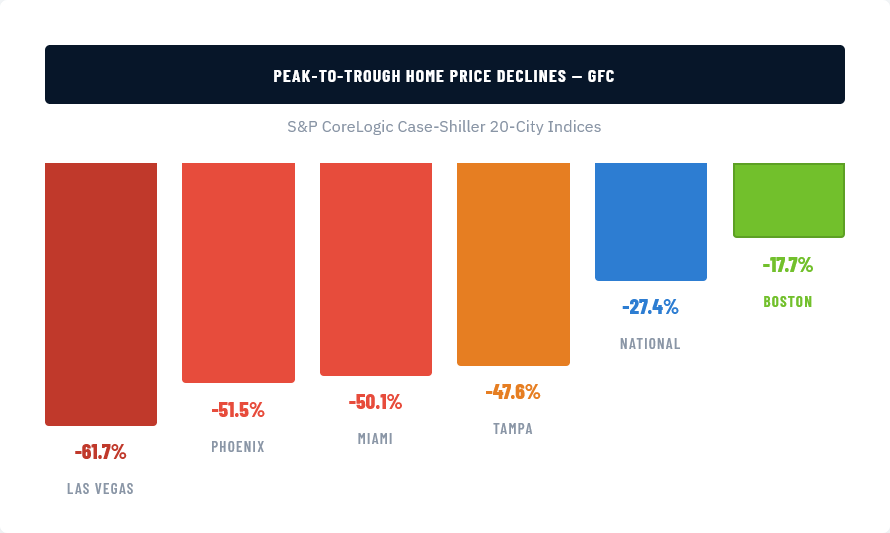
Source: S&P CoreLogic Case-Shiller 20-City Home Price Indices, peak-to-trough (2006–2012)
Proven Durability Through the Great Financial Crisis
When U.S. housing markets collapsed, Boston held firm. Home prices declined just 17.71% peak-to-trough — far less than the 27.42% national average and a fraction of the 47.61% decline in Tampa. Boston also recovered faster than any other major metro, reinforcing its status as one of America’s most resilient housing markets.
Source: S&P CoreLogic Case-Shiller 20-City Home Price Indices, peak-to-trough (2006–2012)
Delays Create a Sweet Spot for Private Lending
Boston’s development timeline is unpredictable. Once entitlements are secured, developers need capital fast. Traditional banks — constrained by regulation, committee approvals, and post-GFC risk aversion — take 60 to 105 days to fund. Meanwhile, regulatory pullback from the 1-to-20 unit residential lending segment continues to widen the gap. GenWel funds in 1 to 21 days — converting institutional inertia into a durable lending opportunity.
-
1–21 DAYS
-
60–105 DAYS
Active Lending Footprint
The GenWel portfolio is concentrated across Greater Boston and New England, with 92% of loans in Massachusetts. The interactive map below shows our active lending density across the region.
Portfolio allocation: 92% Massachusetts, 3% Maine, 3% Rhode Island, 2% New Hampshire. Data as of Q1 2025.
Structural Scarcity. Durable Demand.
Greater Boston’s housing crisis isn’t cyclical — it’s structural. The combination of an enormous unit deficit, surging home prices, and a population that increasingly cannot afford entry creates a market where disciplined private lending isn’t just viable — it’s essential.
Sources: 2025 Greater Boston Housing Report Card; S&P CoreLogic Case-Shiller Boston Home Price Index; MAPC analysis
Connect with GenWel Capital
Robert Napolitano, Managing Partner
-
Phone
+1 339.788.1375 -
Office
30 Braintree Hill Office Park, Suite 201
Braintree, MA 02184
Explore Our Investment Strategies
Greater Boston’s housing constraints create durable opportunities for disciplined capital. Learn how GenWel converts these market dynamics into investor results.
Important Disclosures — Please Read
This website is for informational purposes only and does not constitute an offer to sell or a solicitation of an offer to buy any security. Any such offer or solicitation may be made only by means of a Confidential Private Placement Memorandum (“PPM”) and related subscription materials, which contain material information about the applicable fund, including risks, fees, and conflicts of interest.
Investments in private funds are speculative, involve a high degree of risk, are illiquid, and may result in the loss of some or all invested capital. Past performance is not indicative of future results.
Offerings are available only to “accredited investors” as defined under Rule 501 of Regulation D. Verification of accredited investor status is required prior to investment.
GenWel Capital LLC is not registered as an investment adviser with the Securities and Exchange Commission. Napier Financial is a registered investment adviser; references to Napier Financial on this website are for informational purposes and do not constitute investment advice. Neither GenWel Capital LLC nor its affiliates is a broker-dealer.